Exercises
8.5. Exercises#
1. At a restaurant, the amounts on the checks are i.i.d. with mean 40 dollars and SD 30 dollars. Let \(T\) be the total amount on 200 checks and let \(M\) be the mean amount on those 200 checks.
a) Find \(E(T)\) and \(SD(T)\).
b) If possible, sketch the approximate distribution of \(T\) and mark \(E(T)\) and \(SD(T)\) appropriately on your sketch. If this is not possible, explain why not.
c) Find \(E(M)\) and \(SD(M)\).
d) If possible, sketch the approximate distribution of \(M\) and mark \(E(M)\) and \(SD(M)\) appropriately on your sketch. If this is not possible, explain why not.
2. Suppose the numbers of M&Ms in the small 1.69-ounce bags of the candy are i.i.d. with mean 55 and SD 2. Let \(X\) be the total number of M&Ms in 100 such bags. Find or approximate \(P(X > 5525)\).
3. A population consists of 1 million people. Incomes in the population have an average of 70,000 dollars and an SD of 30,000 dollars. A simple random sample of 400 people is taken from the population.
Sketch your best guesses of the shapes of the following histograms and provide your reasoning.
a) the histogram of the 1 million incomes in the population
b) the histogram of the 400 incomes in the sample
c) the probability histogram of the income of a person drawn at random from the population
d) the probability histogram of the average of a simple random sample of 400 people drawn from the population
4. [Continuing the previous exercise.]
a) Fill in the blank with a number: At least 75% of the population has incomes in the range 70,000 dollars plus or minus \(\underline{~~~~~~~~~~~~~~~~~~}\) dollars.
b) Fill in the blank with a number: With chance about 75%, the average income of the sampled people is in the range 70,000 dollars plus or minus \(\underline{~~~~~~~~~~~~~~~~~~}\) dollars.
5. Suppose the weights of sticks of butter are i.i.d. with a mean of 115 grams and an SD of 5 grams. Let \(X\) be the total weight of 600 such sticks. Find \(x\) such that \(P(X > x)\) is approximately 95%.
6. A coin is tossed 100 times. Let \(X\) be the number of heads.
a) What is the distribution of \(X\)?
b) Sketch the normal curve that approximates the distribution of \(X\). Mark the numerical values of \(E(X)\) and \(SD(X)\) appropriately on the sketch.
c) Use the approximation in Part b to get a rough numerical value for \(P(45 \le X \le 55)\).
d) Find the exact numerical value of \(P(45 \le X \le 55)\) and compare with the answer to c. The approximation is pretty rough.
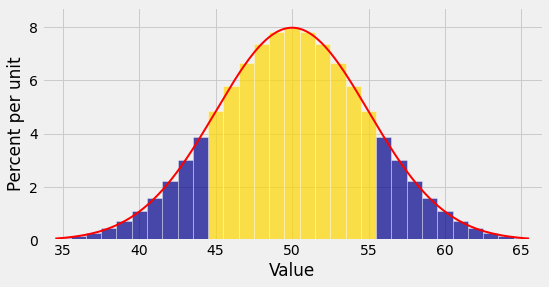
e) The figure below shows the probability histogram of \(X\) and the approximating normal curve. Fill in the blanks:
\(P(45 \le X \le 55)\) is the area of the bars centered over the integers \(\underline{~~~~~~~~~~~~~~}\) through \(\underline{~~~~~~~~~~~~~~}\). This is approximately the area under the red curve between the points \(\underline{~~~~~~~~~~~~~~}\) and \(\underline{~~~~~~~~~~~~~~}\) on the horizontal axis.
f) Use Part e to get a better normal approximation for \(P(45 \le X \le 55)\). This is called the normal approximation with continuity correction. You are correcting for using a continuous curve to approximate a discrete histogram.