6. Measuring Variability#
Expectation is the center of gravity of a probability histogram, and is thus a measure of where the histogram is located on the number line. But histograms of very different distributions can have the same expectation.
In the example below, both Distribution 1 and Distribution 2 balance at 3.5.
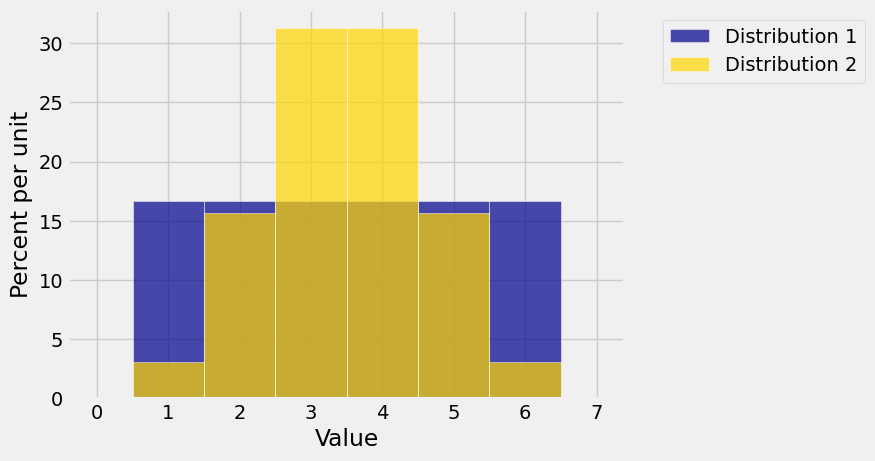
The probabilities in Distribution 2 are more concentrated around the center of the distribution. So it seems less spread out than Distribution 1.
In this chapter we will quantify the spread or variability in a distribution. Once we have defined a measure of spread and examined how to calculate it, we will see what it tells us about the tails of the distribution, that is, probabilities of values that are far away from the expectation.